Summary
This paper presents a new technique which has been developed to achieve production allocation at a reduced cost by the Vietnam Petroleum Institute (VPI). A case study of using geochemical fingerprint technology to back allocate commingled well stream from multiple reservoirs in an offshore basin, southeast Vietnam has been carried out. A large number of oil samples were collected over time and analysed by gas chromatography for their fingerprint and production allocation. Quantitative results were attained using a proprietary computer program which mathematically calculates the relative contributions of end member oils based on chromatographic data. The geochemical allocation results compare very favourably with the metering data. The success of the geochemical allocation allows the cost of field operation to be reduced and effective support to be given to the production management.
Key words: Back allocation, gas chromatography, geochemical finger-printing.
1. Introduction
Crude oils originating from different producing zones, wells, or fields are mixed through commingling operation for reducing operation cost, improving production efficiency and field management. For technical reasons, it is sometimes necessary to quantitatively deconvolute these mixtures to facilitate monitoring of individual zones, wells, or fields. For example, where multiple pipelines commingle, an accurate assessment of individual field contributions may be essential for establishing sales value or tax liability because oil quality or tax rates can be different between neighbouring fields that share a transport pipeline to terminal facilities. The ability to back allocate helps in effectively managing reservoirs and production operations.
Normally, field/reservoir allocation is done by monitoring individual field production with flow meters or by MPLT (Memory Production Logging Test) running. However,inthiscase,therewasalackofdedicatedmetering for production from some fields/reservoirs during a period of time. Moreover, the tax liability was different for those neighbouring fields that shared a pipeline to transport oil to terminal facilities. Thus, it was necessary to investigate alternative methods for reallocating production from these fields/reservoirs in order to determine an accurate field/reservoir contribution. The use of geochemical fingerprinting technique presented in this report is one method to re-assess and crosscheck individual field/ reservoir contribution to commingled pipeline oils.
Geochemical-based oil allocation has been applied for allocation of commingled production from multiple zones and production from multiple fields to a single stream [1, 2]. This method uses whole-oil chromatography distinctive peak height ratios to quantify the contribution of each individual production stream to a commingled production stream. The distinctive compounds are natural fingerprints for oil classification or oil grouping and used for proration of each end-member oil in the commingled oil [3].
2. Methodology
The methods are based on the assumption that oils from separated reservoirs or different parts of a reservoir bear different chemical signatures or distinctive chemical fingerprints. At the reservoir scale, steep gradients in oil composition and associated fluid properties are understood to be the product of preferential biodegradation of different hydrocarbons, which gives oils a distinct molecular signature or “fingerprint” related to the level of degradation. This natural variability in oil composition can be used to allocate oil production along horizontal wells or to assess the contribution of different production streams in commingled wells by mapping the original oil composition distribution.
Each oil type is identified and clarified through a data set of physicochemical properties named fingerprints. Depending on different targets, oil fingerprints are determined by gas chromatography, biomarker analysis, IR, UV-VIS instruments, trace element, and isotope analysis which can lead to high capacity of oil type identification. For example, the original oil type of gasoline and oil spill can be determined by fingerprint analysis.
Using whole oil gas chromatography fingerprints in order to identify oil type is the most popular method which uses a set of peak height ratios to identify oil type. The height or area of a GC (gas chromatography) peak reflects the concentration of a hydrocarbon component of the oil. Due to approximately 1000 peaks in a whole oil gas chromatogram, the distinctive peaks are usually chosen according to experience rather than their chemical nature. Therefore, many sets of GC fingerprints exist from different laboratories.
Depending on the oil field, these compositional differences exist for one or more of the following 3 reasons [4]:
- Oils from different sources differ in composition since oils from different source rocks have different times of generation and/or different migration paths.
- Oil, which a source rock generates at a given time, differs slightly both from subsequently generated oil and previously generated oil due to continuous, subtle changes in the maturity of source rock and changes in precisely which part of the source rock is in the oil window. Since no two compartments are of identical geometry, and since no two compartments have exactly the same filling history, it is difficult to achieve precisely the same homogenised composition in two separate compartments - even with oil from the same source.
- Processes that affect oil composition after oil enters a reservoir (such as biodegradation, water washing, evaporative fractionation) do not operate to exactly the same extent in separate compartments.
Figure 1. A whole oil gas chromatogram [5]
Figure 2. Commingled production and allocation [6]
If two oil zones (1 and 2) were commingled, the respective contributions of the zones to the commingled sample could be determined by identifying the chemical differences between end-member oils, with the end member being pure samples from core or cuttings samples from the production well or nearby delineation wells to those of the produced oils (1 and 2). The combination of mass chromatograms as molecular fingerprint data and direct measurement of specific component abundances in oil samples are then made numerically. The data were then used to mathematically express the composition of the commingled oil in terms of contributions from respective end-member oils.
The relationship between a GC peak height ratio Y (measured in the GC of a commingled oil) and the GC peak height ratio X of the corresponding peaks in the “m” end- member oils being commingled is given by a linear relationship of the form:
In which:
Y = β1X1 + β2X2 + ... βmXm (1)
Y: The peak height ratio matrix of commingled oil;
X1, X2... Xm: The peak height ratio matrix of m end-member oils;
β1, β2... βm: The percentages of m end- member oils.
Production allocation is the process of determining the values of β1, β2... βm for end-member oils.
In reality, there are multiple sources of error, including the following:
- Analytical error in measuring the height of each GC peak;
- Error associated with potential contamination of GC peaks;
- Error associated with the non-ideality of the samples chosen as end-members.
Because of the various sources of error, certain GC peaks will do a better job than others at allocating each zone’s contributions to a commingled oil. It is impossible to know, in advance, which GC peaks will do the best job of the potentially hundreds available in an oil allocation process.
Figure 3. An example of NNMF (non-negative matrix factorisation) algorithm in least square technique [7]
The problem thus becomes one of a linear regression. Specifically, given a set of samples containing a value for each independent variable and the corresponding value of the dependent variable, the “β” values must be computed in a relationship of the form:
Y = β1X1 + β2X2 + ... βmXm + E
Where, “E” represents the error that is not captured by the linear relationship.
Linear regression can be used to converge upon a set of β value that minimises the sum of the square of errors (min|E|2).
The advantage of geochemical allocation
Geochemical allocation of commingled production from multiple zones in a single well typically costs less than 5% as much as conventional e-line production logging. The cost saving is even more dramatic when compared to those for coiled-tubing-conveyed or tractor- conveyed MPLTs.
The low cost of geochemical production allocation allows field engineers to monitor output frequently over long time periods (e.g., weekly, monthly, and quarterly), allowing early identification of zone performance problems. The much higher cost of production logging limits that technique to infrequent use. Therefore, production logging typically provides only a snapshot of the production origin at the time the log was run, rather than a continuous performance history [2].
Geochemical fingerprinting techniques are applicable to highly deviated and horizontal wells, in addition to vertical wells. By contrast, production logging interpretation is problematic in highly deviated wells. Geochemical fingerprinting techniques can be applied to all types of pumping wells, including those with tubing-deployed electrical submersible pumps, and progressive cavity pumps. Other than those with unusual completion style, such as Y-block completion, most pumping well cannot accommodate a production logging tool, because the pumping apparatus prevents logging tool’s access to the underlying perforated interval.
The geochemical allocation approach can also be used to assess the contribution of multiple fields to commingled pipeline production streams. There are some additional advantages including the ability to allocate in the absence of flow meter data, and the ability to identify problems with flow meter data.
Procedure
Oil samples collected from wellhead were taken to the laboratory for geochemical analysis. GC processing was carried out by Chemstation software, chemometric tools and polynomial statistic to group oils and identify distinctive pairs of peaks for allocation calculation.
3. Case study of geochemical production allocation
Geochemical-based allocation method was developed by the Vietnam Petroleum Institute and has been applied for hundreds of oil samples collected from different fields. The paper introduces the application of this method for commingled well P01 in A field, offshore Vietnam.
Figure 4. The principal diagram of a GC-FID system [5]
Figure 5. Agilent 6890N gas chromatography
Table 1. Oil samples collected from A field
Sampling and analysis
Miocene reservoir, A field, includes 2 pay zones: clastic and carbonate. P01 well started producing in 2011 and has been perforated at both clastic and carbonate reservoirs. In order to determine the oil contribution of these two reservoirs to P01 well, clastic and carbonate oil samples from P02 and P03 respectively were collected to be the end-members.
The whole oil samples (Table 1) were fully analysed on Agilent 6890N. Gas chromatograms are input data for Geochemical Allocation software to identify oil group and allocate commingled production.
Qualitative results
Oil - oil correlation is usually evaluated according to [1, 8]:
- light hydrocarbon distribution (based on C7 isomers);
- hierarchical cluster analysis (based on whole oil gas chromatograms).
Light hydrocarbon distribution (B-F diagram) was used to determine the differences between Miocene oils produced from the clastic and carbonate reservoirs of Afield. Figure
6 shows the correlation between aromatic index (toluene/n-heptane, B) and saturated index (n-heptane/methylcyclohexane, F). The differences between oils produced from two pay zones are displayed through alkane, aromatic and naphthene hydrocarbon correlation. The negative slope illustrates the secondary alternation such as evaporative fractionation, thermal cracking, water washing, and biodegradation [8]. When this slope translates to the right, the maturity of source rock generating these oils increases.
Figure 6. B-F diagram of wells P01, P02 and P03
Figure 7. Hierarchical cluster analysis diagram of VPI-P01, VPI-P02 and VPI-P03
As shown in the B-F diagram, the samples of VPI-P02 and VPI-P03 are located at two separated areas, it means that the oil geochemical properties from these two wells are highly different (VPI-P02 represents oil from clastic reservoir and VPI-P03 represents oil from carbonate reservoir). Moreover, the oil samples from these VPI-P02 and VPI-P03 are located along two parallel straight lines which therefore can be considered as the trends of clastic and carbonate oils respectively.
The oil samples from VPI-P01 were found very near the location of carbonate trend. These results illustrate that oil from carbonate reservoir mostly contributes to the oil production stream of VPI-P01.
Using all GC whole oil data of VPI-P01, VPI-P02 and VPI-P03 as an input data to run the cluster analysis, the dendrogram is shown in Figure 7 with two distinct groups. Accordingly, the samples of VPI-P01 and VPI-P03 are grouped in one cluster and the other cluster is VPI-P02 with very large distance. Hence, the oils from VPI-P01 and VPI-P03 have a distinct carbonate reservoir signature, whereas the oil from VPI-P02 has clastic signature. The distances between the groups (along the x-axis) are a relative measure of the magnitude of differences among the oils. Therefore, carbonate and clastic oils are clearly separable with large compositional discrepancy. Once again, this result proves that the oil flow from carbonate reservoir mainly contributes to the production stream of VPI-P01.
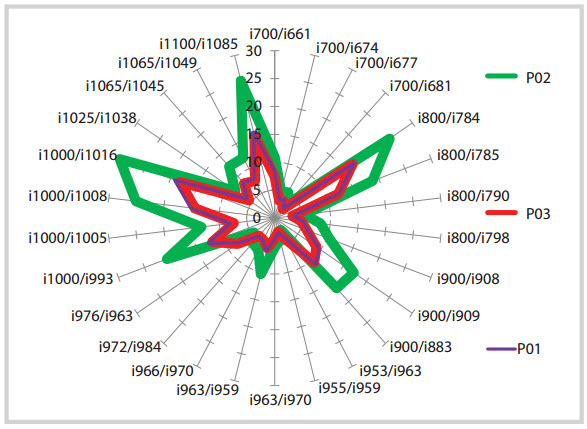
In addition, from over 500 chromatographic peaks (corresponding to more than 500 hydrocarbon compounds in a GC chromatogram from C6 to C14), through the adaptive algorithm and visual inspection, 26 pairs of distinctive chemical compounds (or 26 distinctive peak height ratios) were screened and chosen to display on the stardiagram. According to the star diagram, the difference between the geochemical properties of VPI-P01/VPI-P03 and VPI-P02 can be easily observed (Figure 8).
 |
| |
Figure 8. Polar (star) plot of selected peak ratios for well P01, P02, and P03
Quantitative results
Assuming oil from well VPI-P02 is an end‐member oil of the clastic reservoir and oil from well VPI-P03 is an end-member oil of carbonate reservoir, the oil from well VPI-P01 is now considered as commingled oil from two reservoirs and therefore need to be allocated. Distinctive peak height ratios are chosen from approximately 1,000 gas chromatography peaks from C6 to C35 as input data of the Geochemical Allocation Software for allocation calculation.
The allocation results of commingled well VPI-P01 show the contribution of both clastic and carbonate reservoirs to oil stream of P01 and vary from time to time. However, oil from carbonate reservoir mainly contributes tocommingled oil stream of well P01 during the observed period. It illustrates that oil produced from P01 is characterised by oil produced from carbonate reservoir. These results are consistent with the qualitative results in 3.2.
In order to evaluate the accuracy and validate the technique, the geochemical allocation results were compared with field production data based on MPLT running for well VPI-P01. Allocation of well VPI-P01 oils based on logging result compares very favourably with the geochemical result on the same date. The high agreement (in this case less than 1%) observed indicates the validity of the geochemical fingerprinting method.
4. Conclusion
Geochemical fingerprinting technique with gas chromatography is a valuable method to accurately allocate commingled production stream and production pipeline. The results of allocation calculation of commingled wells based on their geochemical fingerprints are in excellent agreement (generally within 3%) with the actual production logging data. This method can be used to replace other methods (MPLT or metering) to determine the oil allocation from commingled wells/ pipelines more frequently because of their cost saving and high accuracy.
References
1. R.I.Hwang, D.K.Baskin. Reservoir connectivity and oil homogeneity in a applications in the Gulf of Mexico. Proceedings of the 9th Annual Research Conference of the Society of Economic Paleontologists and Mineralogists, New Orleans. 1 October, 1990.
2. R.L.Kaufman, H.Dashti, C.S.Kabir, J.M.Pederson, M.S.Moon, R.Quttainah, H.AI-Wael. Characterizing the Greater Burgan field: Use of geochemistry and oil fingerprinting. SPE Reservoir Evaluation and Engineering. 2002; 5(3): p. 190 - 196.
3. Barry Bennett, Jennifer J.Adams, Stephen R.Larter. Oil fingerprinting for production allocation: Exploiting the natural variations in fluid properties encountered in heavy oil and oil sand reservoirs. Frontiers + Innovation. CSPG CSEG CWLS Convention. 2009: p. 157 - 160.
4. Brooks A. Patterson and Mark A. Beeunas, Geochemical comparison of Rang Dong Field oils, Cuu Long basin, Vietnam. 2006.
5. David K.Baskin, Alan S.Kornacki, Mark A.McCaffrey. Allocating the contribution of oil from Eagle Ford formation, the Buda formation, and the Austin Chalk to commingled production from wells in South Texas using geochemical fingerprinting technology. AAPG Annual Convention and Exhibition, Pittsburgh, Pennsylvania. 19 - 22 May, 2013.
6. Scott Ramos, Brian Rohrback, Glenn Johnson, Russell Kaufman. Using gas chromatography and curve resolution to quantify contributions to mixed crude oils. 56th Pittsburgh Conference, Orlando, Florida. 2005.
7. Daniel D.Lee, H.Sebastian Seung. Algorithms for non-negative matrix factorization. Advances in neural information processing systems 13. The MIT Press. 2001: p. 556 - 562.
8. H.I.Halpern. Development and application of light- hydrocarbon based star diagrams. AAPG Bulletin. 1995; 79(6): p. 801 - 815.
9. Marcio M.Lobão, Jari N.Cardoso, Marcio R.Mello, Paul W.Brooks, Claudio C.Lopes, Rosangela S.C.Lopes. Identificationofsourceofamarineoil-spillusinggeochemical and chemometric techniques. Marine Pollution Bulletin. 2010; 60(12): p. 2263 - 2274.
10. Nguyen Xuan Thanh. Reservoir geochemical evaluation of the Rang Dong basement oils in offshore Vietnam. 1999.